Sample Data Collected at 900 MHz
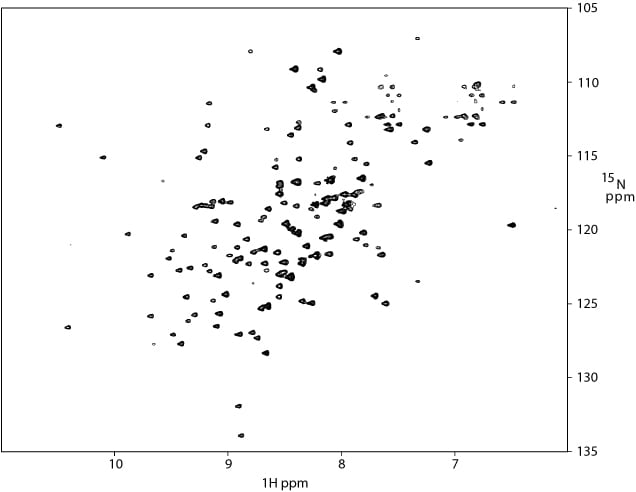
1H-15N TROSY of an 18 kDa protein (15N/13C/2H labeled) in complex with its receptor.
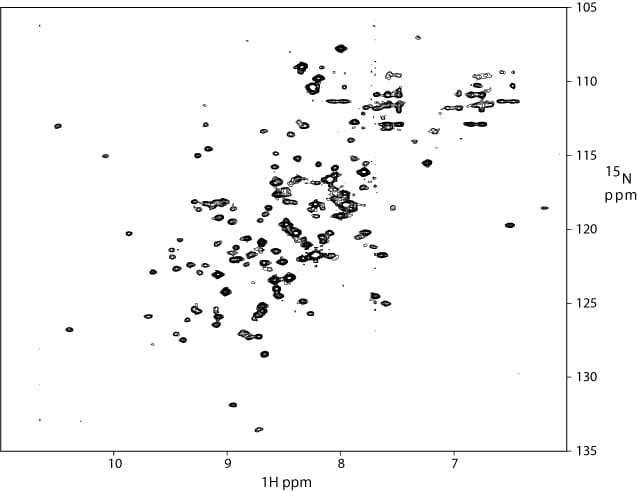
1H-15N TROSY of a 95 kDa complex of the 18 kDa protein (on left) with two other proteins (concentration ~ 150 uM; spectrum was recorded for 18 hours ).
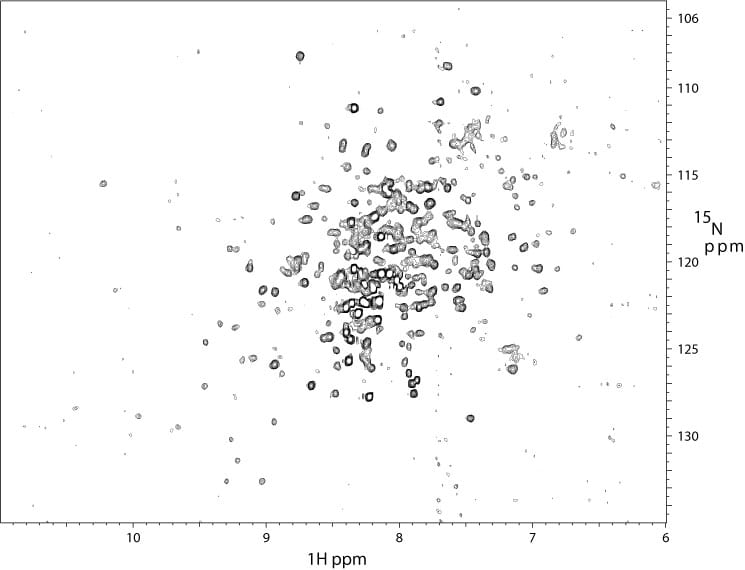
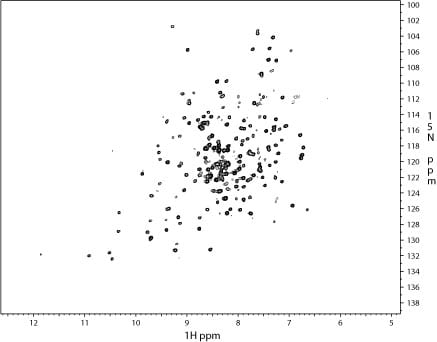
2D 1H-15N TROSY spectrum of a 35 kDa tumor suppressor protein at 900 MHz. The sample was both 15N-and 2H-labeled.
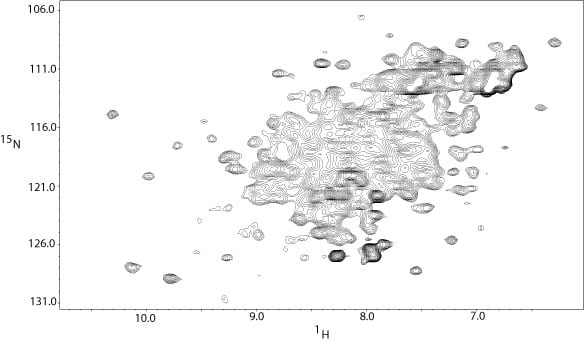
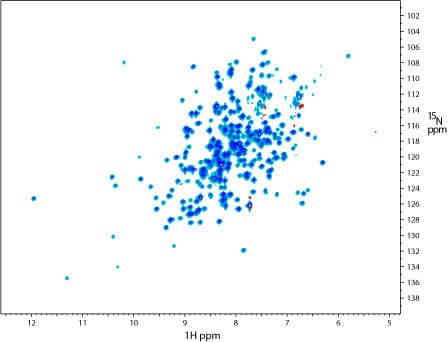
2D 1H-15N HSQC spectrum of the same 35 kDa tumor suppressor protein at 600 MHz. The sample was 15N-labeled, but not deuteriated. At lower field and without deuteriation, the sample quality is much worse. The combination of deuteriation and availability of the 900 MHz instrument makes this project possible.
2D 1H-15N TROSY spectrum of a 270 residue kinase acquired at 900 MHz. The sample was 15N,13C, and 2H-labeled and at a concentration of 300 uM.
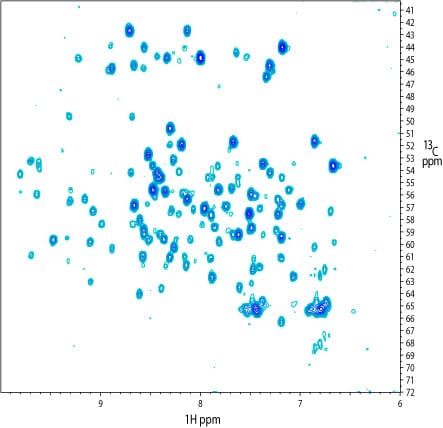
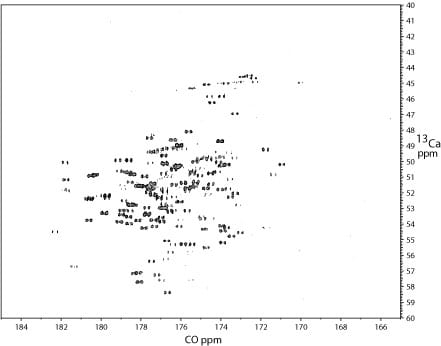
2D 1H – 13C projection of a 3D TROSY-HNCA spectrum of the kinase. Many 13Calpha and 13Calpha(i-1) signals were visible. Notably, a similar spectrum recorded on a Bruker 800 MHz system with a cryoprobe yielded more signals. The reduced number of signals apparent at 900 MHz maybe due to broadening associated with moderate-scale (ms) dynamics.
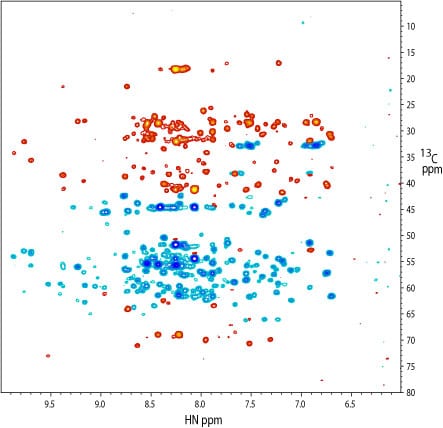
2D 1H-13C projection of a 3D TROSY-HNCACB spectrum of the kinase. 13Calpha signals are colored blue and 13Cbeta signals are colored red. The spectrum was recorded on a 15N, 13C, and 2H-labeled sample at a concentration of 300 uM in a 3 mm NMR tube. The cryoprobe accessory was critical to obtaining spectra of good signal-to-noise.
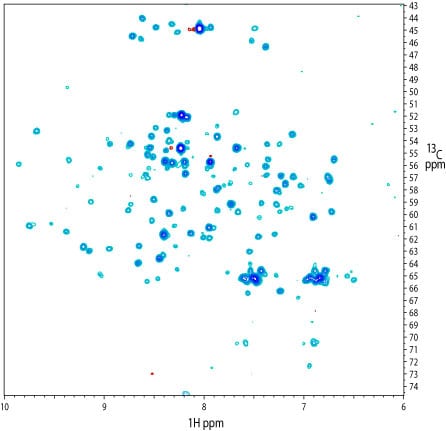
2D 1H-13C projection of a 3D TROSY-HN(CO)CA spectrum of the kinase. The spectrum was recorded on a sample similar to that used for the TROSY-HNCACB (above). Many signals are present, even though strong relaxation of the 13CO resonance is expected at high field.
2D 1H – 15N TROSY spectrum of a 300 residue kinase acquired on the Bay Area 900 instrument before installation of the cryoprobe. The spectrum was recorded on a 15N, 13C, and 2H-labeled sample at a concentration of approximately 750 uM in a 5 mm NMR tube. Collection of the spectrum at 900 MHz was critial to resolve many of the resonances.
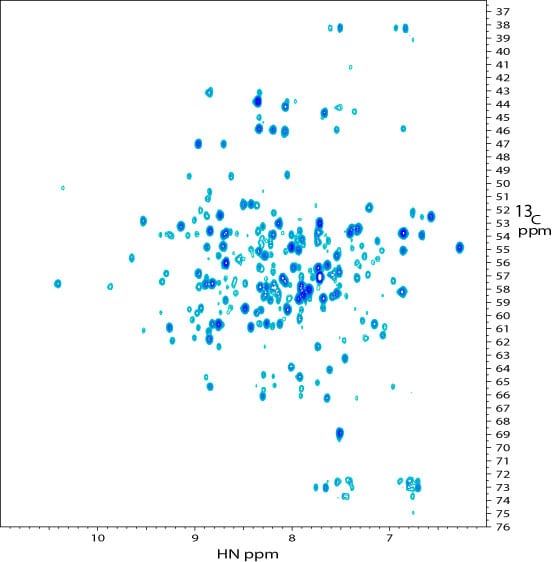
2D 1H – 13C projection of a 3D TROSY-HNCA spectrum of the kinase. The spectrum was recorded on a sample similar to that used for the 2D TROSY spectrum.
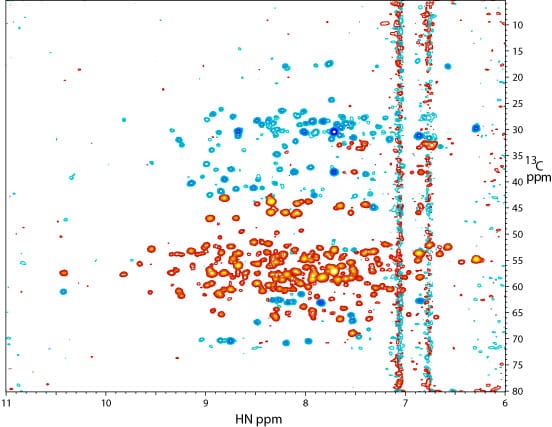
2D 1H – 13C projection of a 3D TROSY-HNCACB spectrum of the kinase at 900 MHz. The spectrum was recorded on the same 15N, 13C, and 2H-labeled sample used to collect the 2D ~TROSY spectrum (above). 13Calpha signals are colored in red and 13Cbeta signals are colored in blue. The cryoprobe accessory was critical in obtaining sufficient signal-to-noise.
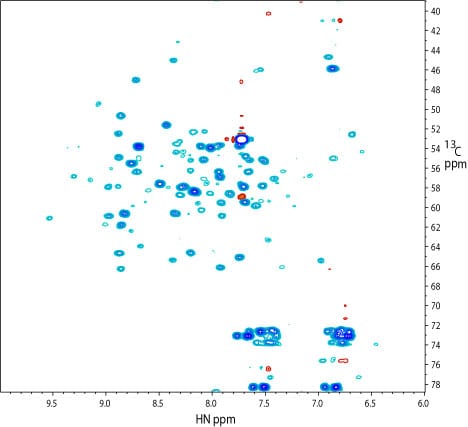
2D 1H – 13C projection of a 3D TROSY-HN(CO)CA spectrum of the kinase. The spectrum was recorded on a sample similar to that used for the 2D TROSY spectrum.
2D carbon-detected CA-CO experiment recorded on a 4 mM sample of the chemotaxis protein CheY (12 kDa) before installation of the cryoprobe. The cryoprobe is optimized for both 1H and 13C, making 13C detection a real possibility.
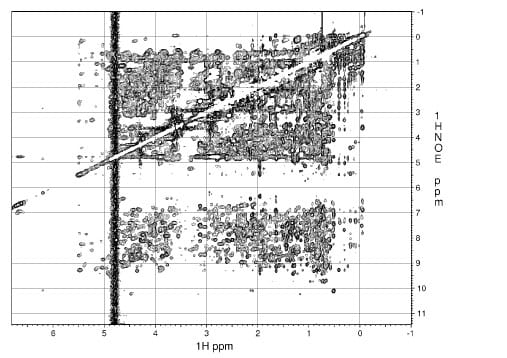
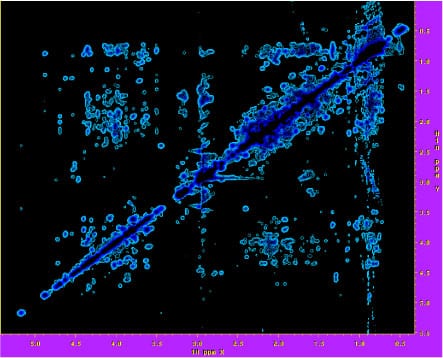
2D 1H – 1H projection of a 3D 13C NOESY spectrum recorded at 900 MHz of a 21.5 kDa signaling protein, used to obtain structural information. The spectrum was recorded with the cryoprobe accessory.
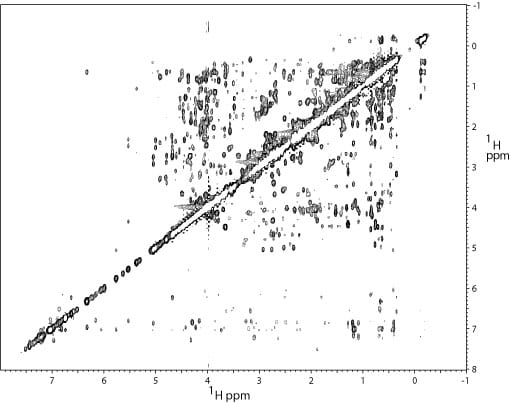
2D 1H – 1H projection of a 3D 13C NOESY spectrum of the N- terminal domain (12 kDa) of the replication initiation protein DnaA. This spectrum was used to obtain distance restraints for the structure determination.
2D 1H-1H projection of a 3D 1H – 13C NOESY spectrum of a 10 kDa polymerase domain.
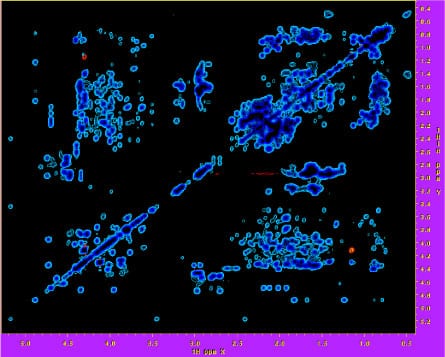
2D 1H-1H projection of a 3D 1H – 13C NOESY spectrum of a 10 kDa polymerase domain.
